British Columbia’s Approach to Climate Change
Dr. Mir F. Ali
Like other Canadian provinces and territories across the country, British Columbia got sick and tired of waiting for the federal leadership for climate change and decided to adopt the attitude, reflecting the popular phrase – Lead, follow or get out of the way.
Consequently, the Greenhouse Gas Reduction Targets Act (GGRTA) was given Royal Assent on November 29, 2007 and brought into force on January 1, 2008. This piece of legislation is considered to be a major step forward in the fight against global warming. With British Columbia’s annual emissions exceeding 66 million tonnes of carbon dioxide equivalent (CO2e), this legislation signaled a major step towards confronting the Province-wide contribution to global warming. This legislation defines British Columbia’s reduction targets for greenhouse gas (GHG) emissions, and the government’s commitment to a carbon-neutral public sector by 2010.
The GGRTA established specific targets mandating that total BC emissions be reduced by 33 percent by 2020 and 80 percent by 2050 from 2007 levels. The Province subsequently set interim targets of 6% reduction by 2012 and 18% by 2016 based on realistic and economically viable strategies.
Recognizing that 43% of emissions are under the influence of regional districts and municipalities, the Province requires that all local governments identify GHG reduction targets, policies, and plans in their Official Community Plans. In order to forward these efforts, the Province has recently released draft Community Energy and Emissions Inventories (CEEIs) for all local governments in British Columbia.
According to an explanation provided under the heading “Why does my local government need a CEEI report?”, an energy and GHG emissions inventory can be a valuable tool that helps local governments plan and implement GHG and energy management strategies, while at the same time strengthening broader sustainability planning at the local level. CEEI reports have two primary purposes:
- To fulfill local governments’ Climate Action Charter commitment to measure and report their community’s GHG emissions profile; and
- To establish a base year inventory for local governments to consider as they develop targets, policies, and actions related to the Province’s new Green Communities Legislation (Bill 27).
As an additional benefit, CEEI Reports support BC local government members of the Federation of Canadian Municipalities’ Partners for Climate Protection program to achieve Milestone. One of the community streams – a community GHG emissions inventory.
According to the CEEI user guide, the following are included/excluded in each sector of the report:
- Buildings:
- Included: This sector includes all electricity and natural gas delivered by the four major utilities in the Province – BC Hydro, Fortis BC, Terasen Gas Inc, and Pacific Northern Gas Ltd. This information is broken down into residential, commercial, and industrial subsectors. For each subsector, the energy consumed and the related greenhouse gases is shown along with the number of physical connections or accounts which is illustrated in the next graph; and
- Excluded: This sector does not include electricity distributed by systems not owned or operated by BC Hydro or Fortis BC (industrial self-generation, remote community systems, etc.), but does include electricity purchased by local governments to service a segment of their community (e.g., Nelson Hydro). This sector also does not include heating oil, propane, except as noted above, or wood, due to the existing difficulty in obtaining province-wide data for these energy types.
- On Road Transportation:
- Included: Only vehicles on-the-road included. This represents all vehicles registered to be driven on public roads, including personal vehicles such as small passenger cars and large passenger cars, light trucks and vans passenger vans, and sport utility vehicles; motorhomes; motorcycles and mopeds; commercial vehicles such as cargo vans, panel trucks, heavy trucks, ambulances, and fire trucks; tractor trailer trucks; and buses, representing transit and private buses; and
- Excluded: It does not include vehicles not licensed to be driven on public roads such as bulldozers, forklifts, all terrain vehicles, etc. It also does not include slow moving heavy equipment that is licensed to be operated on public roads such as rollers, pavers, backhoes, graders, etc. Also, the draft 2007 CEEI Reports do not include marine, rail or air transportation. One or more of these sectors may be added in the future.
- Solid Waste:
- Included: It includes estimates of the annual mass (tonnes) of municipal solid waste (MSW) disposed of at all regional district landfills and attributed to contributing municipalities, as well as each community’s estimated share of CO2e (methane) emissions; and
- Excluded: Waste that is not disposed of at a regionally operated landfill (e.g., a forestry landfill), some industrial waste, compostable material, green waste, and waste originating from federal lands, not included in the Reports. There are also no estimates CO2e provided for closed landfills. Demolition, land clearing and construction (DLC) waste, which is considered relatively inert, has not been included in the tonnage figures where known. The waste shipped to Metro Vancouver’s Waste-to-Energy facility and the overall CO2e contribution has been included in the tonnage figures.
Out of all municipalities in BC that were included in the CEEI reports, a municipality which represents a relatively small population of under 15,000 was selected to conduct a walkthrough with the objective to explain how CEEI could be used in a meaningful way. The following three graphs are designed to provide three different views of the respective CEEI inventory:
1. Carbon Oxide Equivalent (CO2e) Tonnes by Sector:

The graph on the left shows that a total of 1,116,158 GJ of energy was consumed by their Building and Transport sectors in 2007, resulting GHG emission equivalent indicated on the graph on the right.
The graph on the right shows that in 2007, this municipality has emitted a total of 56,980 tonnes of community CO2e in the atmosphere which represents 36,874 Tonnes or 64.7% for their Transportation, 10,529 Tonnes or 18.5% for their Buildings, and 9,577 Tonnes or 16.8% for their Solid Waste.
2. Energy Consumed/Emission Emitted View:

The graph (Figure2) is designed to illustrate what kind of energy is being used and as a result of the use of the energy, what kind of GHG emissions are emitted in the atmosphere in this particular municipality. Buildings are split into three categories – Residential, Commercial, and Industrial.
3. GHG Emitted by each type of Energy:

The graph presented above (Figure3) is designed to demonstrate the magnitude of each type of energy is being consumed in this municipality and as a result what kind of GHG emissions are being emitted in the atmosphere.
Here is an approach (Figure4) to setting GHG emission targets, developing strategies, producing action plan, and monitoring/reporting GHG emissions reductions in a municipality:
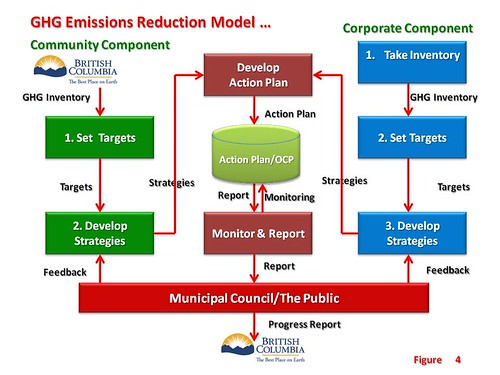
This graph is designed to illustrate the ways to handle the community and corporate components of the GHG emissions in a municipality. The following represent the highlights of the proposed approach:
- The first thing to recognize is that the CEEI inventory is only for the community component of GHG emissions not the inventory for the corporate component;
- The CEEI inventory is provided for the three sectors – Buildings, Transportation, and Solid Waste whereas the corporate inventory will be required on all municipal facilities and municipal operations including: municipal buildings, street and traffic lights, Municipal fleet, operational waste, etc.;
- The first step in the process of setting GHG emission targets is to project the amount of emission for the future years. A typical practice is to aggregate the amount of emission by the growth factor for the population of the municipality. For instance, if the growth factor for this municipality is determined to be 3 percent increase in the population for the next 10 years and assuming that the population of the municipality was 100,000 in 2007, the aggregated emission for the future years will look like this:
- 103,000 Tonnes for 2008;
- 106,090 Tonnes for 2009;
- 109,273 Tonnes for 2010;
- 112,551 Tonnes for 2011; and
- 115,927 Tonnes for 2012.
- Similarly, if they decided to reduce their GHG emissions by 5 percent in 2010, 2011, and 2012. They must realize that their target of 5 percent will help reduce only two percent of the inventory (target 5 – 3 growth factor);
- The focus of the strategies will be different for the corporate and community components, therefore, they have to be developed independently from each other. However, a common approach should be used to determine what will it take to accomplish the targeted results, what kind of time frame is feasible, what kind of resources will require, who is going to do what and when, etc.;
If 2007 is going to be used as base year and municipalities were not provided the CEEI inventory until 2009, the chances are that municipalities will focus on the year 2010 to start taking action to reduce GHG emissions which also means that they have to take into consideration the aggregated total in 2010, which represent 109,273 not 100,000 as shown in the example above;
- The development of an action plan is a combined effort to consolidate both, corporate and community plans, avoiding duplications, overlaps, and ambiguity. The action plan can be used as a blue print to reducing the desired level of GHG emissions in the municipality;
- The finalized action plan is summarized and incorporated into the Official Community (OCP); and
- The function of monitoring and reporting is a critical activity, ensuring that the Council as well as the public is kept informed with the progress and their feedback is channelled back into the process for necessary action. Furthermore, the progress report is provided to the provincial government.
While the provincial government has good intentions towards climate change and they have initiated a critical process to achieve those intentions, the following is a very aggressive and unrealistic agenda which is going to put businesses (Municipalities are required to become carbon neutral by 2012) in a very peculiar position as they are faced with some real fiscal challenges:
- The GGRTA requires the public sector to become carbon neutral by 2010 and to make a public report available annually that details action taken towards carbon neutrality. The provincial government (including individual ministries and agencies), schools, colleges, universities, health authorities and Crown corporations are all included in this commitment.
The European model for reducing GHG emissions was immensely successful simply because the European municipalities were empowered by their provincial and federal governments and they were provided with ample financial incentives for all sustainable projects and initiatives throughout their jurisdictions. The BC government started out on a very positive note by recognizing the need for climate protection and making some financial provisions in their pre-election budget which earned them enough votes to have another majority government. Sadly, in their last budget, they clearly demonstrated that they lost interest in any and every climate change initiative and no significant financial provision were included in the budget.
Despite of the financial adversity, most, if not all, municipalities in British Columbia appear to believe in climate protection and they seem to be totally committed to the reduction of GHG emissions in their jurisdictions. They are eagerly seeking ways to proceed with the plan to set realistic GHG emissions targets, develop necessary plans and policies to be incorporated in their Official Community Plans with the objective to make them happen. They may not be able to meet the requirements of the GGRTA to become carbon neutral in 2012 but they are on their way to accomplishing what they can. What they need to make sure of is that in their attempt to reduce GHG emissions in their jurisdictions, they are not neglecting their basic responsibilities and they are not compromising the quality of services they are responsible for delivering to their citizens.
Comments